Data Analysis, Visualization and Interpretation
I want to bring order to data, communicate it in a visual format, and attach meaning to the data...
What is it?
Data Analysis is the process of bringing order and structure to collected data. It turns data into information teams can use. Analysis is done using systematic methods to look for trends, groupings, or other relationships between different types of data.
Data visualization is the process of putting data into a chart, graph, or other visual format that helps inform analysis and interpretation. Data visuals present the analyzed data in ways that are accessible to and engage different stakeholders. Data visuals are also used to communicate MEAL results to meet key stakeholder needs. Multiple visuals will likely be needed to understand the larger change process and inform data use. Common data visual formats include:
- Frequency tables
- Cross-tabulation tables
- Bar charts
- Line graphs
- Pie charts
- Heat Maps
- Scatter graphs.
Data interpretation is the process of attaching meaning to the data. Interpretation requires making conclusions about generalization, correlation and causation, and is intended to answer key learning questions about your project.
These three processes are not usually linear – they don’t follow each other in an orderly process. Instead, they support, inform and influence each other, resulting in data that are rich and useful.
How do I use it?
DATA ANALYSIS AND VISUALIZATION
The type of data analysis you do is determined by the type of data you have and the information needs outlined in the project Performance Management Plan.
Quantitative data allows you to count and conduct quantitative, statistical analysis. It generally tells you “what” is happening with your project.
There are two main types of quantitative analysis:
- Descriptive analysis is used when you want to understand the patterns and characteristics of a particular group, usually your sample. It includes frequencies or counts, percentages, and measures of central tendency, which are mean, median, and mode. It also includes measures of variability, which tell you the “spread” or variation of the responses.
- Inferential analysis is used when you want to examine differences and correlations between groups. It includes tests such as t-Tests, ANOVA, and Chi-Square. It also includes regression analysis, which can help you understand the cause and effect relationships in your data.
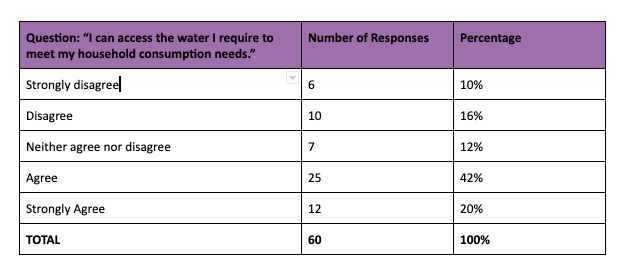
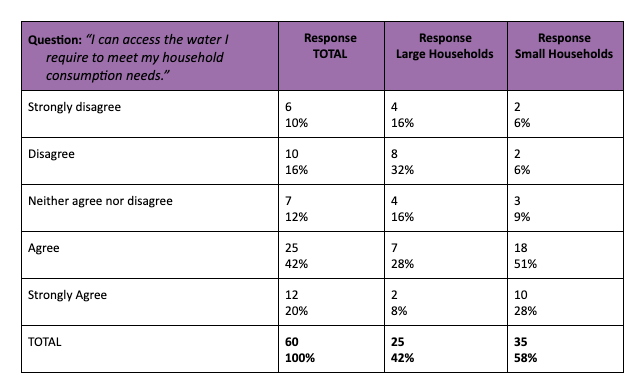
Quantitative analysis is supported by data visualizations such as frequency tables and cross-tabulation tables.
A frequency table is a visual representation of the frequency of values in your data set.
A cross tabulation table is a visual representation of the frequency of values of an entire data set, including sub-groups within the data set.
Visuals assist with both data analysis and data communication. When you are using visuals to aid communication the MEAL DPro suggests following these steps:
- Step 1: Define the stakeholder(s). This will help you understand which type of visual will appeal to which stakeholders and best meet their information needs.
- Step 2: Define the data visualization content. This means determining the “need to know” content for each stakeholder.
- Step 3: Design and test your visualization. Do not crowd your visuals with too much data. Get started on paper, with the audience-specific content that was identified. For each key audience identified, different visualizations or dashboards may need to be designed.
- Step 4: Build your visualizations. Team members with the skill and experience in digital software can build data visualizations, using the prototypes that were developed in a small group or workshop setting.
Qualitative data, in the form of words and stories, is analyzed by identifying and organizing themes. This analysis generally tells you “why” and “how” change is happening with your project.
Qualitative analysis is used with qualitative data and is often called “content” or “thematic” analysis.
These themes are organized and visualized using a matrix, which orders themes according to the various perspectives present and the questions asked. Any new categories and themes that emerge as a result of this process will inform the next stage of analysis.
DATA INTERPRETATION
Quantitative analysis generates frequencies, averages, and levels of difference that exist in your data. Qualitative analysis identifies themes and patterns. Both types of analysis need to be interpreted to make sense of the information they give you. Together with your team and other important stakeholders you interpret your data set by giving meaning to it. The meaning you give it is the story of your project – the story you will use to make project decisions and share your results with others.
Your interpretation efforts may lead you back to the analysis stage, requiring more visualization, and then more interpretation. This iterative process generates high-quality data that you can use.
When do I use it?
Planning documents, particularly the Performance Management Plan, will tell you when to analyze, visualize, and interpret your data. Often, quantitative and qualitative analysis are done separately. Then, the results are interpreted together, providing a more complete picture of ‘what’, ‘how’ and ‘why’ change is happening in your project context.
In many cases, data analysis, visualization and interpretation takes place prior to producing a report document or as part of a critical monitoring or evaluation exercise. However, experts recommend that planning these processes as part of regular monitoring efforts will improve project learning and assist with adaptive management, thus improving project implementation as a whole.
Tips:
Tip 1: Interpret with your stakeholders
It is recommended that you engage key stakeholders in interpreting results to ensure data use and decisions that are appropriate in the local context. For example, you could convene a stakeholder meeting to help you interpret the data. The multiple perspectives you include in this meeting are critical to the creation of information that will be useful and trusted to help the project improve.
And, it is always useful to validate or test the themes and recommendations you generate as a result of your analysis and interpretation. This validation can be done with any number of stakeholders, including the project participants themselves.
Tip 2: Be aware of interpretation limitations
In order to form interpretations and recommendations that are credible, you need to be aware of and transparent about the limitations in your data. All data have limits in this sense. When you are interpreting, keep the following in mind:
- The type of data you have will limit the interpretation you can do. For example, quantitative data sometimes allows for generalization. Qualitative data does not.
- Your sampling strategy and size will determine what kind of generalization and interpretation you can do. You will only be able to interpret data by sub-group if your sampling strategy includes disaggregation.
- Be transparent about the quality of your data. No data is perfect. Questionnaires will have missing responses, focus group leaders may unintentionally influence respondents, and self-reporting responses may be improperly understood. Your interpretation of both quantitative and qualitative data must incorporate your understanding of the data quality issues that exist in your data.
- Be transparent about the bias that exists, in whatever form, in your data.
Supported by:


Shared by:


Users are free to copy/redistribute and adapt/transform
for non-commercial purposes.
© 2022 All rights reserved.